News
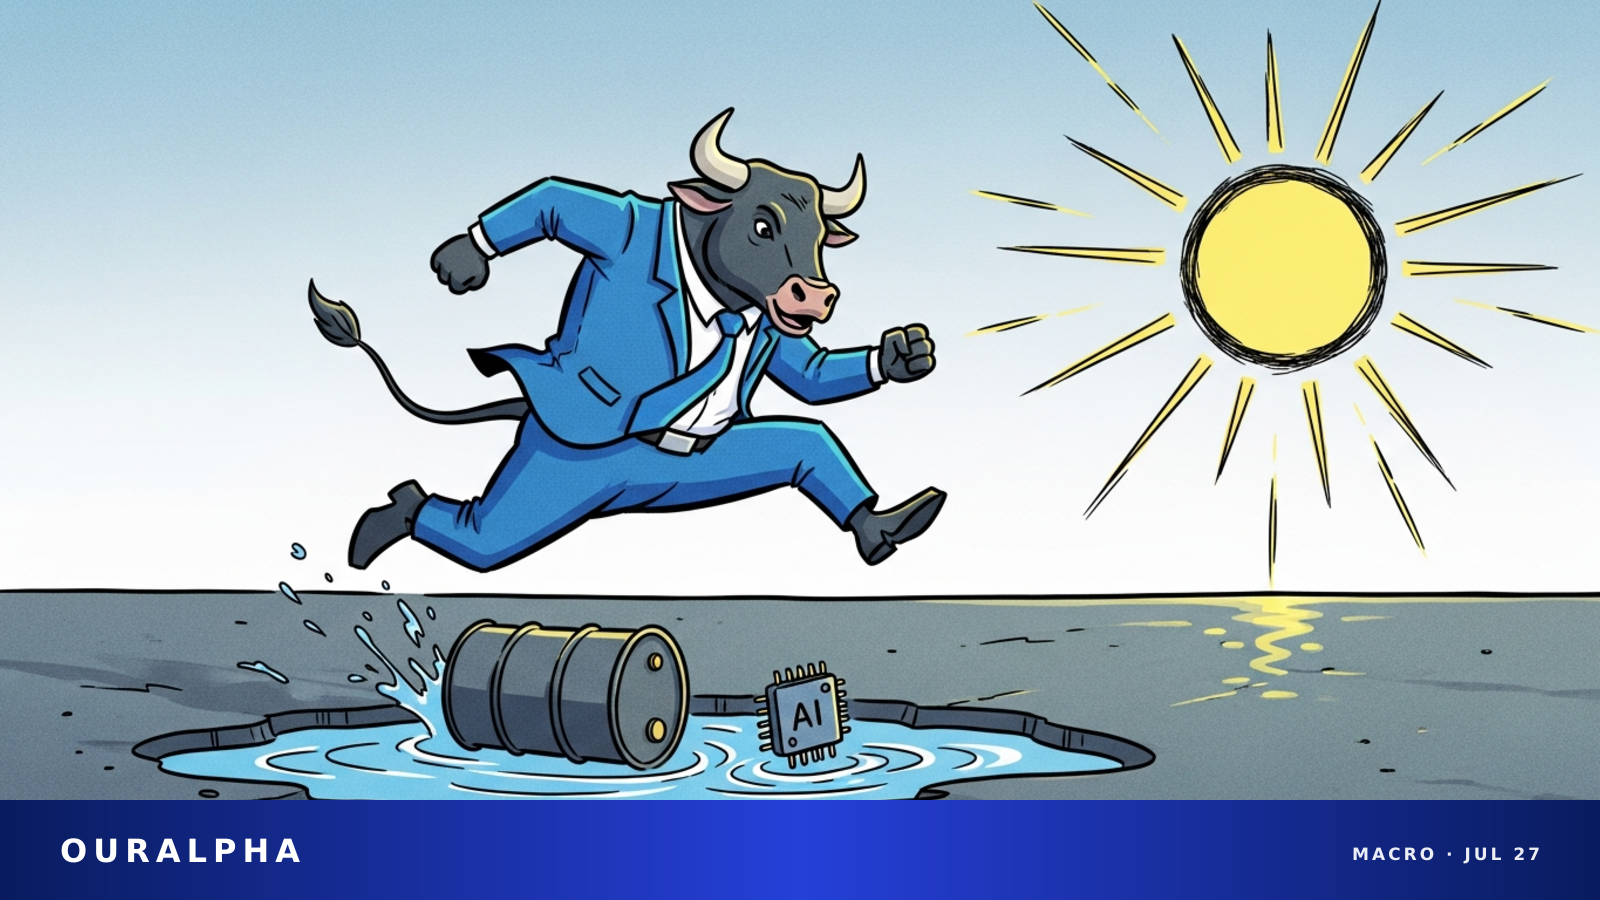
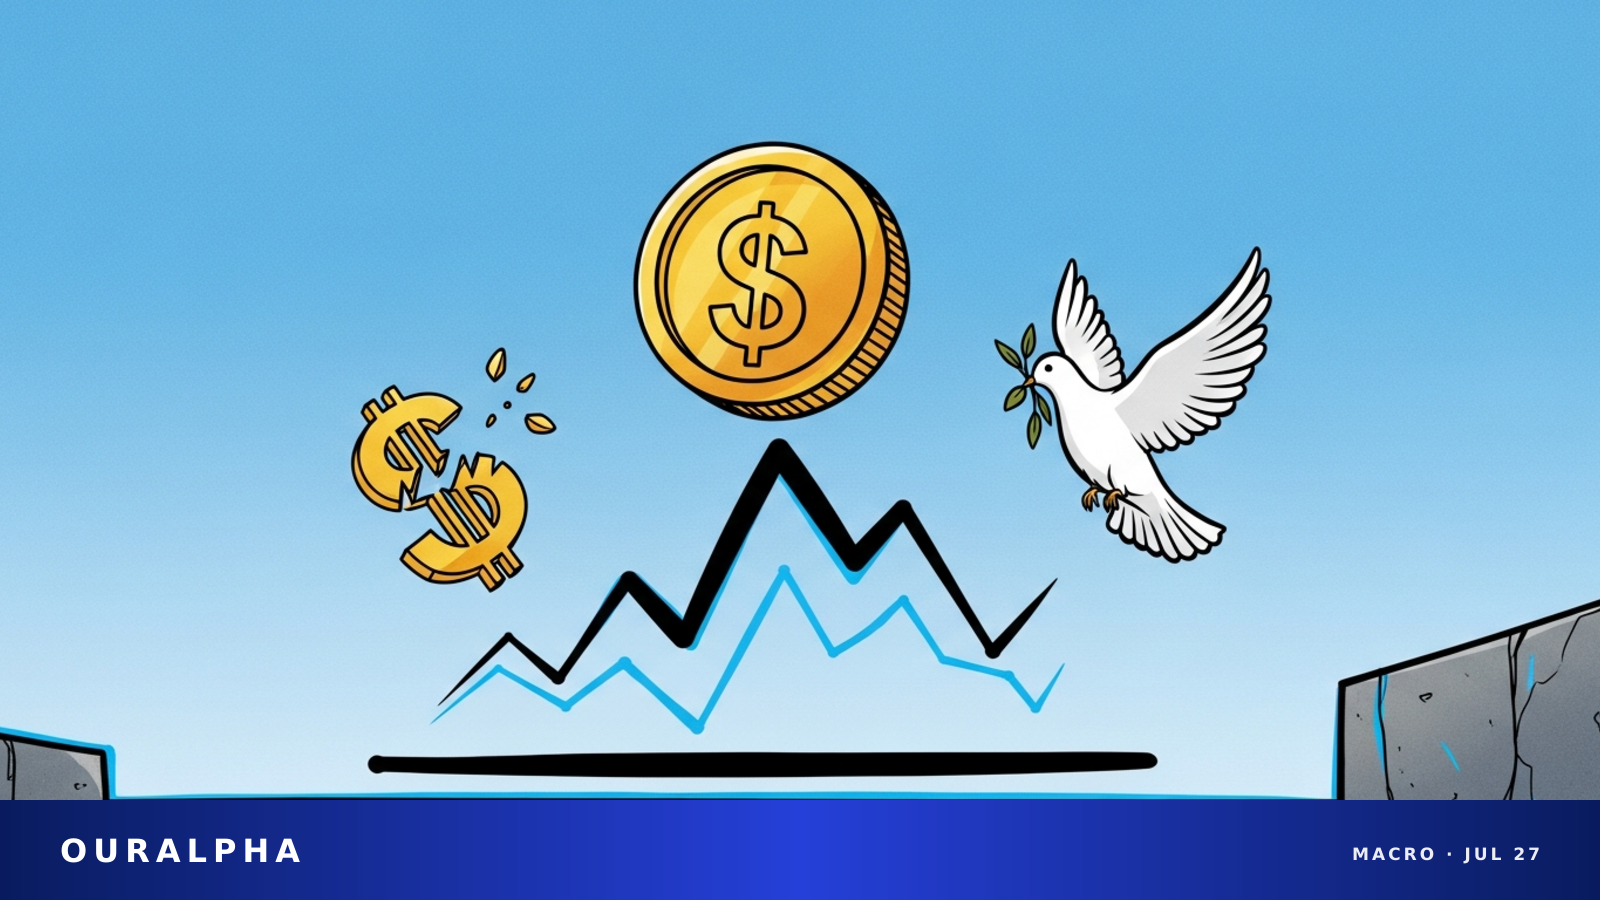
Gold Jumps Above $4,100 as US-Iran Truce Eases Inflation Fears, Dollar Slips; All Eyes on Fed
Gold rallied above $4,100 as a weekend pause in US-Iran hostilities sent oil prices tumbling and the dollar lower. The focus now shifts to the Fed’s rate decision and Chair Warsh’s tone on Wednesday.